The following article details the reports available with the SOLABS QM APPs. We used the Change Control process APP as an example, but the reports are the same for the other APPs.
The Process Section reports are a little more straightforward than regular reports in that there is no specific logic/interpretation behind the results. They are a straightforward reporting of the data, depending on the selections you make on the right-hand side in the Parameters fields. It is important to make careful selections in the Parameters section for the various Statistics reports, in order to get the results you are looking for. More details are provided in the descriptions below and you can learn even more by practicing the various options!
In the example below, "CC" stands for Change Control and the prefix will change according to the QM APP selected.
Again, these are the same reports for each Process APP but are described using the Change Control report list above.
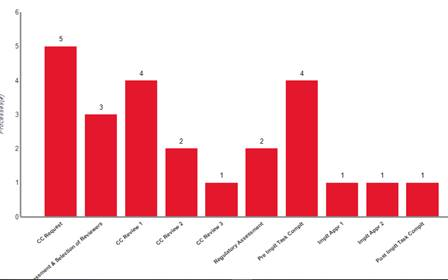
- CC Per Process Step will provide a listing of how many Change Controls are currently in process at each Workflow Step. The number of processes at each step is displayed graphically as well as by numbers on top of each bar.
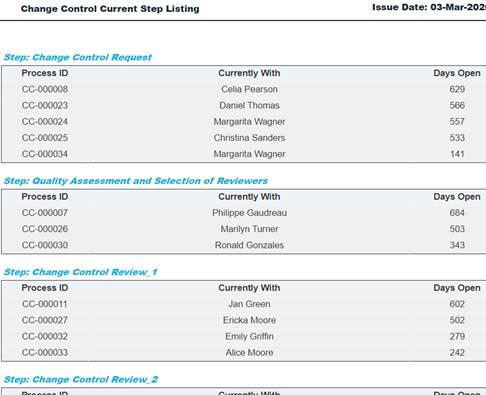
- CC Current Step Listing will provide the same information but now who has each of those steps and how long they have been open.
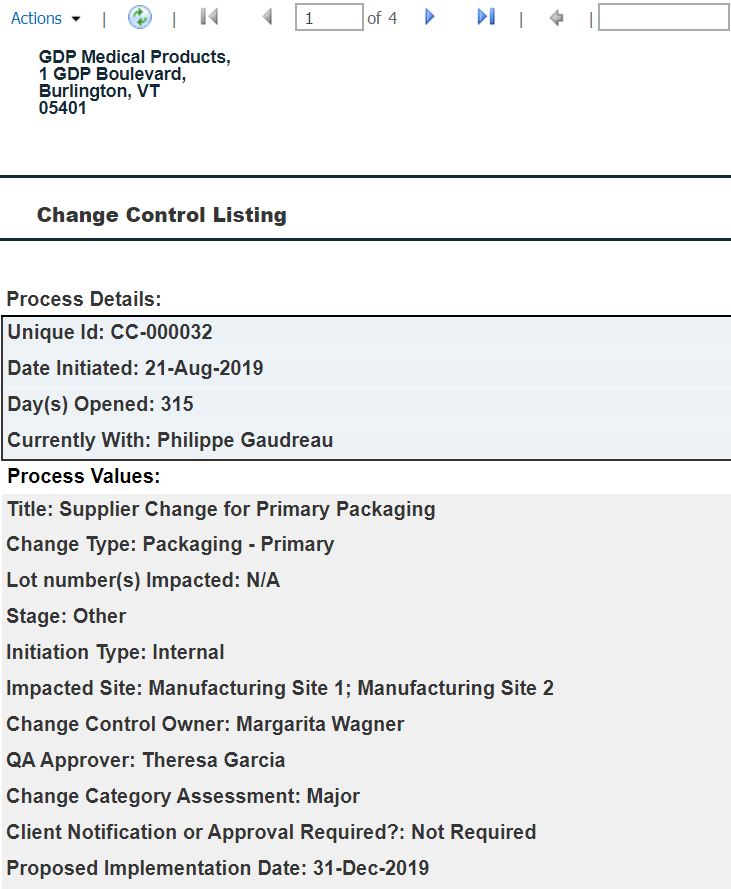
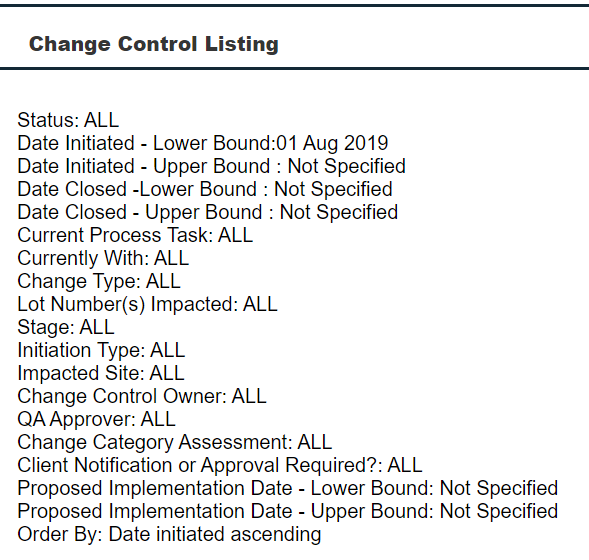
- CC Listing is simply a Table of Change Controls, including the Process Details and Process Values information, based on the parameters you choose – Status, Date Range and/or specific metadata. Depending on how many processes meet the search criteria entered in the Parameters section, the report may be multiple pages. On the last page, the criteria selected in the Parameters section is provided as a reference.
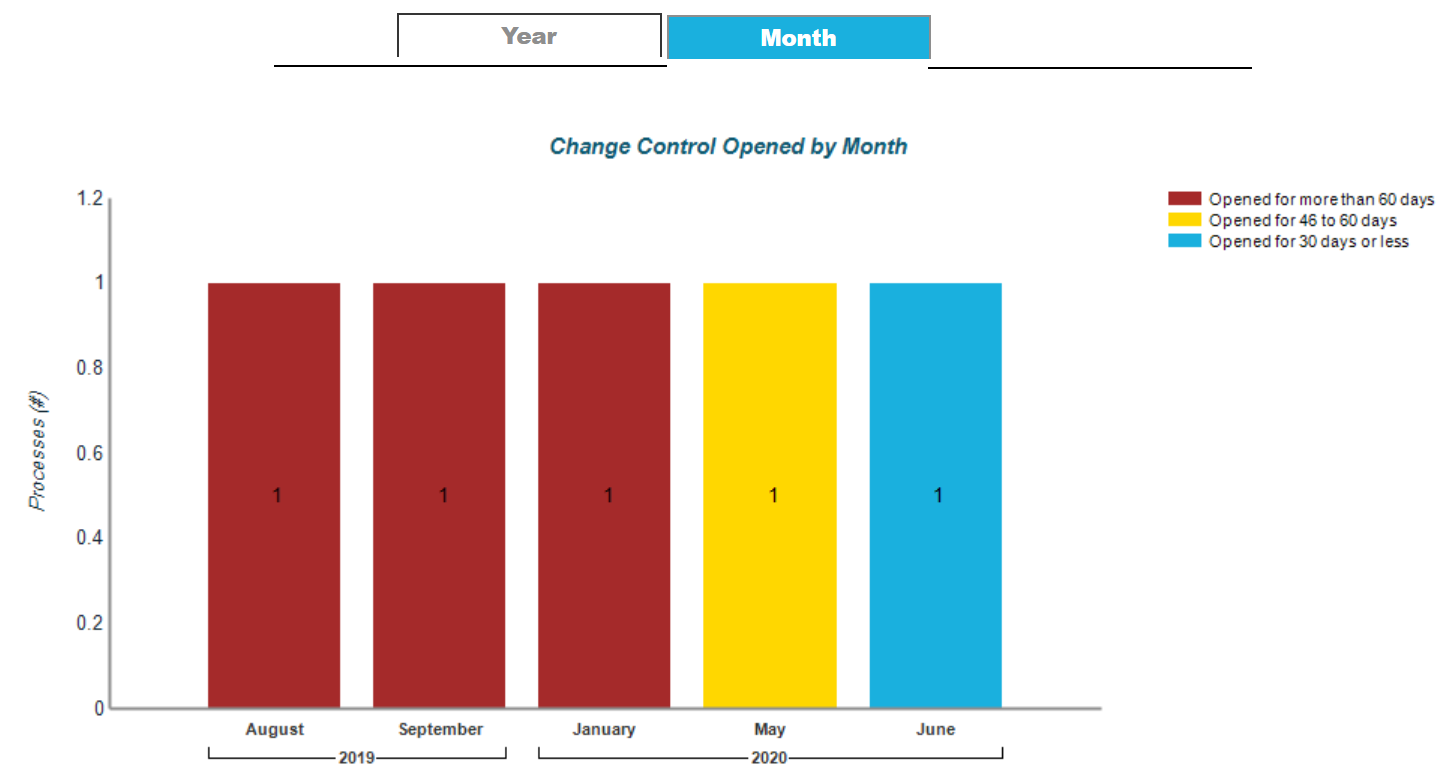
- CC Statistic per Month displays a graph that presents information on how many Change Controls were Opened or Closed within certain date ranges. The number of processes per month is displayed graphically, as well as by a number within each bar. In the Parameters section the Status must be selected as either "Opened" or "Closed". At that point date ranges can be entered. If one of the date ranges is not required, select the "NULL" box to disable that field. To enable a date field, remove the "NULL" checkmark next to that field. There is also a "Choose Number of Days Opened" field to color-code results by how may days the process was open. There may be multiple bars or stacked bars in a particular month if there are processes in more than one category for Days Opened.
NOTE: Refer to the following article regarding an issue with this particular report: https://docs.solabs.com/hc/en-us/articles/1500001875722-Known-Issue-Process-SSRS-Statistics-Per-Year-Month-Reports-Issue
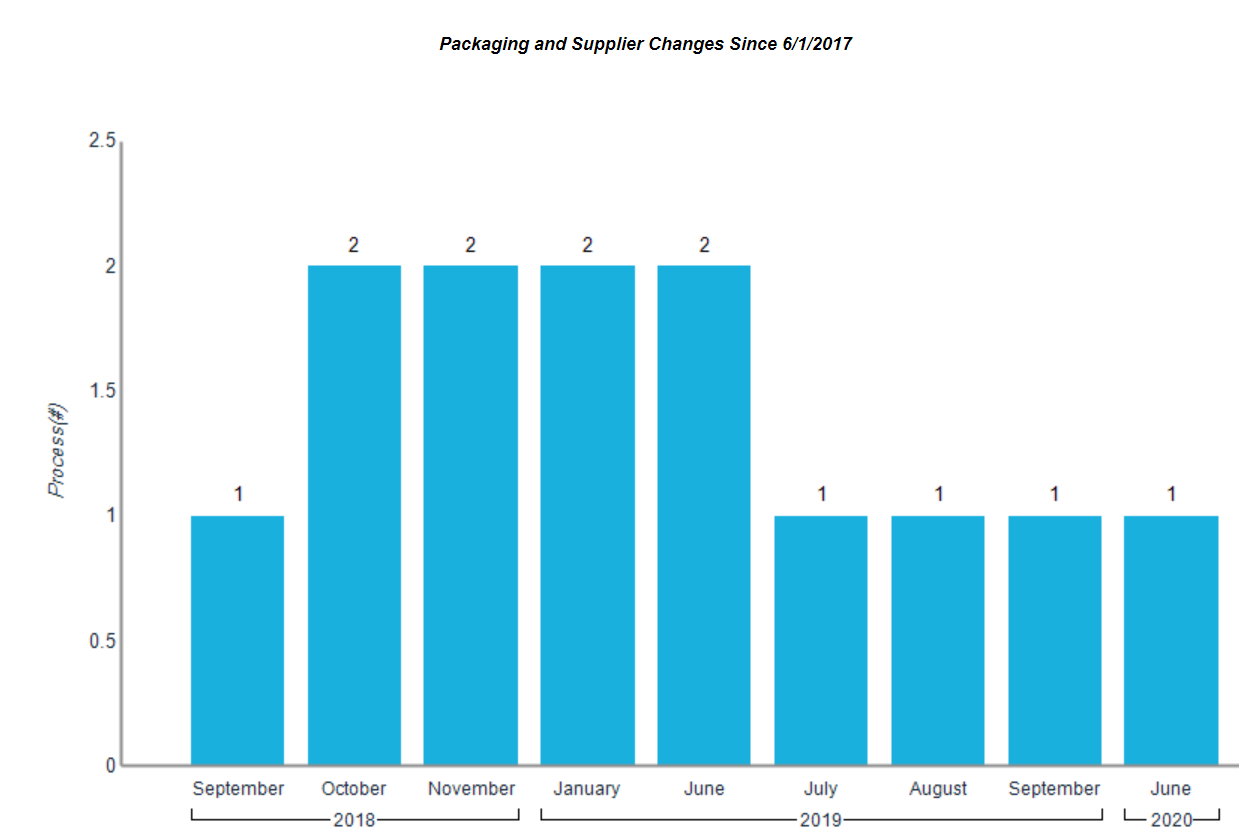
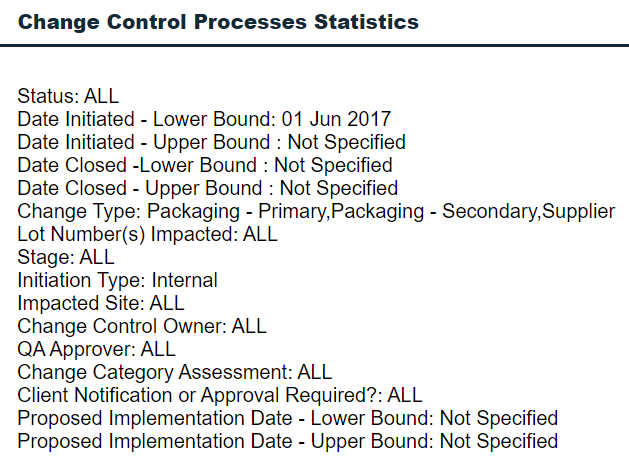
- CC Statistics by Parameter allows the same Status and Date Range selections as the above report but also allows selection of specific metadata information related to the process. As with the other reports, the numbers are displayed graphically as well as by numbers above each bar. The metadata selections are chosen in the Parameters section. A Title can also be entered in order to clearly identify on the resulting graph the related metadata selections. Those selections are also displayed for reference on the second page of the resulting graph.
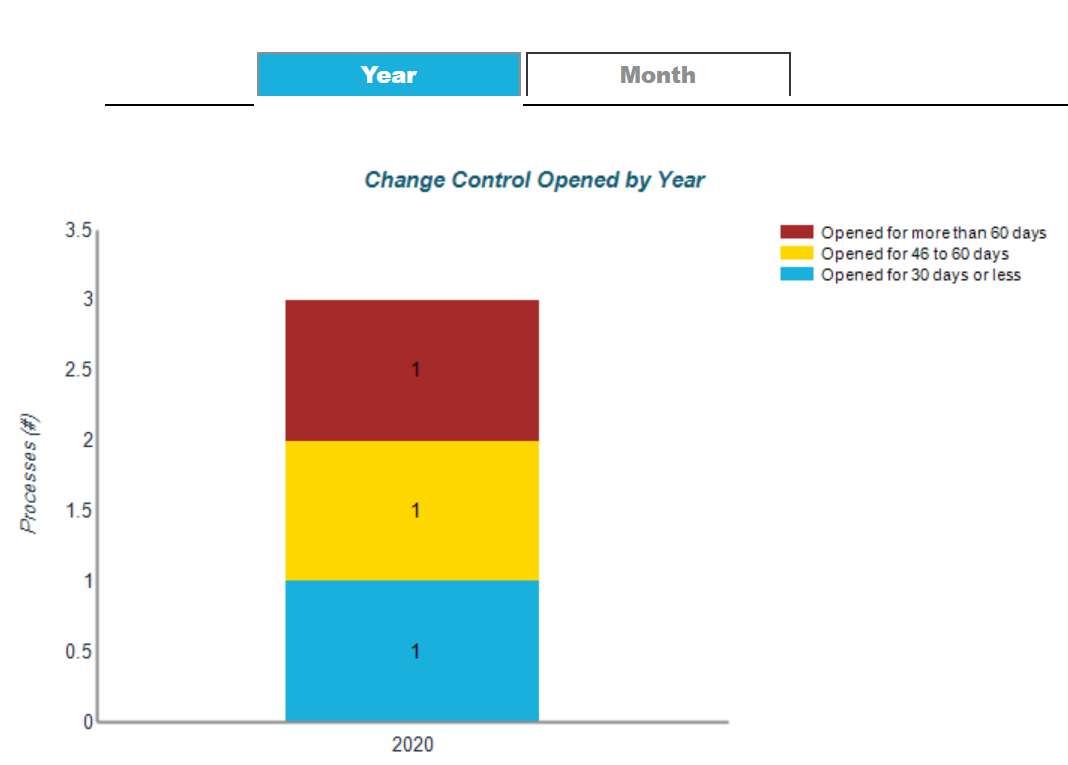
- CC Statistics per Year displays a graph that presents information on how many Change Controls were were Opened or Closed within a certain calendar year. In the Parameters section the Status must be selected as either "Opened" or "Closed". At that point the year can be entered. There is also a "Choose Number of Days Opened" field to color-code results by how may days the process was open. There is an option at the top of the graphs to switch the display to "Month" if you would then like to see what months within the year these processes occurred.
Comments
0 comments
Please sign in to leave a comment.